Understanding the CukeTest Interface
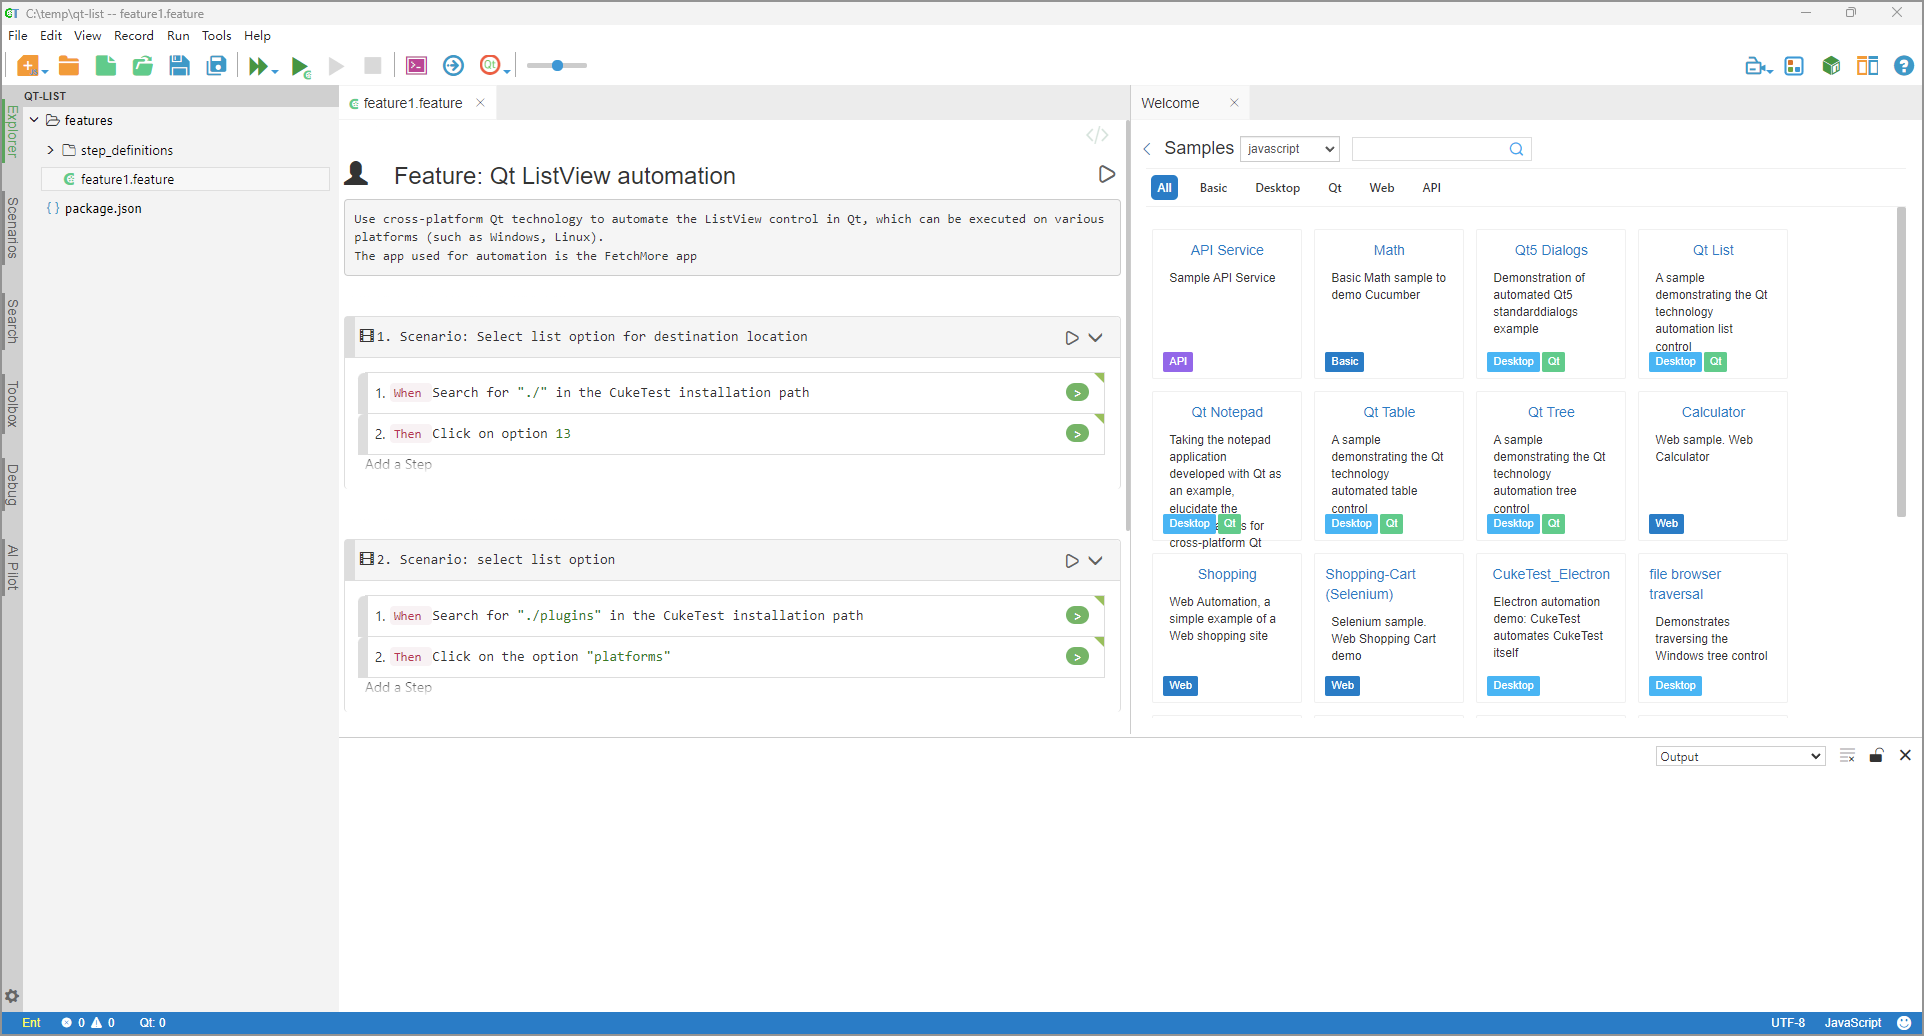
When opening a project in CukeTest, the default user interface appears as follows:
Depending on your CukeTest version and configuration settings, the appearance and behavior of your IDE may vary.

Main Window
The main window allows you to open a single CukeTest project. You can open multiple projects in separate windows. By default, the window title displays the project name and the name of the currently opened file.
The CukeTest main window consists of five sections: menu bar, toolbar, project management area, editor, and status bar.
Menu Bar
The menu bar is located at the top of the main UI and provides various functional options such as File, Edit, Run, View, and Help. By clicking options in the menu bar, you can open or save projects, cut or copy text, run tests, switch view modes, access help documentation, and more.
Toolbar
The toolbar is located below the menu bar and provides shortcuts to frequently used functions such as creating a new project, opening a project, saving a project, running a project, and executing the current scenario. By clicking the toolbar icons, you can quickly perform corresponding actions. See more in Toolbar.
Project Management Area
Located on the left side of the window, the project management area allows you to browse, open, and manage files and folders within a project. This area can also switch to other views, such as Scenarios, Search, Toolbox, and Debugging, via the Sidebar. You can access CukeTest settings by clicking the gear icon in the bottom-left corner to define the software’s appearance and behavior.
Editor
The editor is located in the center of the window and serves as the primary area for writing and editing test cases. Here, you can write or modify test cases using Gherkin syntax to describe test scenarios and steps and use JavaScript or Python to define step implementations (you can simultaneously edit both scenarios and script codes in the left and right panels). The editor also allows you to run and debug test cases.
Status Bar
The status bar is the blue area at the bottom of the main UI.
- The left side of the status bar displays the
current license type, thenumber of errors and warningsduring execution, and details of any actively monitored Qt applications. Clicking the "Qt" text area reveals additional information about the Qt application. - The right side shows the
current encoding format,script language, and afeedback button. If you encounter issues or wish to submit feedback, click the 🙂 icon at the far right of the status bar to open a pop-up window where you can enter and send your message.
Sidebar
The sidebar provides five functional sections: Explorer, Scenarios, Search, Toolbox, and AI Pilot.
- Explorer: View the current project structure and manage project files and folders.
- Scenarios: List all scenarios and steps in the current project. You can also run scenarios and steps directly from this view.
- Search: Perform keyword searches with options for case sensitivity, whole word matching, and regular expressions.
- Toolbox: Drag and drop elements to quickly generate code. See more in Code Toolbox.
- AI Pilot: Provides test case design, report analysis, and test data generation features. See more in AI Pilot.
Console output
Displays output logs during application execution. By default, the console output panel is docked in the lower right corner of the main UI. You can maximize or hide it as needed.
Context Menu
Right-click on various interface elements to see available actions for the current context. For example:
Right-click a scenario in the script to view actions related to that scenario.
Right-click in the editor to see available options for the selected code snippet.
Some actions can also be performed via the main menu at the top of the screen. If an operation supports a keyboard shortcut, the shortcut key will be displayed next to its name.