Inspector
Playwright Inspector is a GUI tool that helps authoring and debugging Playwright scripts.
- Open Playwright Inspector
- Stepping through the Playwright script
- Using Browser Developer Tools
- Debugging Selectors
- Recording scripts
Open Playwright Inspector#
There are several ways of opening Playwright Inspector:
Set the
PWDEBUGenvironment variable to run your scripts in debug mode. This configures Playwright for debugging and opens the inspector.# Linux/macOSPWDEBUG=1 npm run test # Windows with cmd.exeset PWDEBUG=1npm run test # Windows with PowerShell$env:PWDEBUG=1npm run testAdditional useful defaults are configured when
PWDEBUG=1is set:- Browsers launch in the headed mode
- Default timeout is set to 0 (= no timeout)
Call page.pause() method from your script when running in headed browser.
// Pause on the following line.await page.pause();Use
openorcodegencommands in the Playwright CLI:npx playwright codegen wikipedia.org
Stepping through the Playwright script#
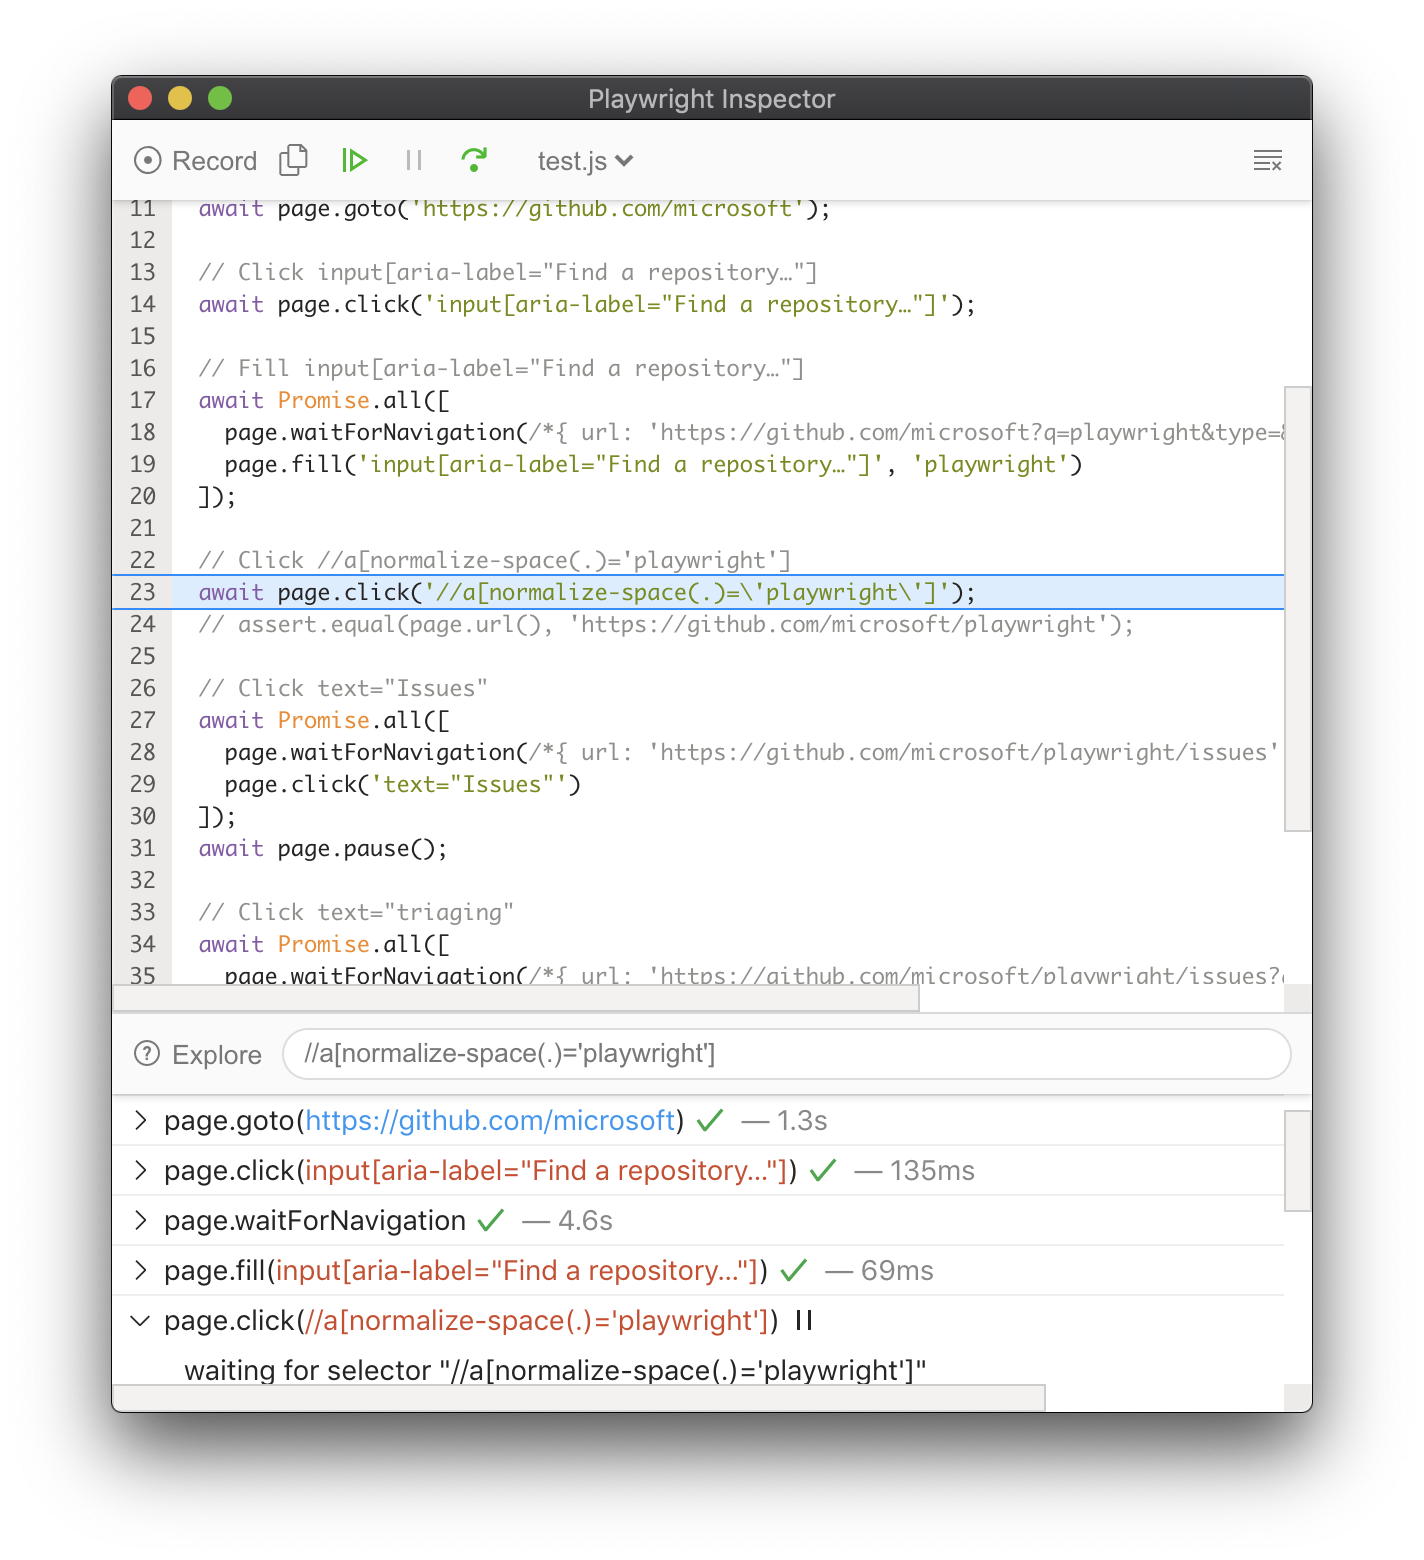
When PWDEBUG=1 is set, Playwright Inspector window will be opened and the script will be paused on the first Playwright statement:

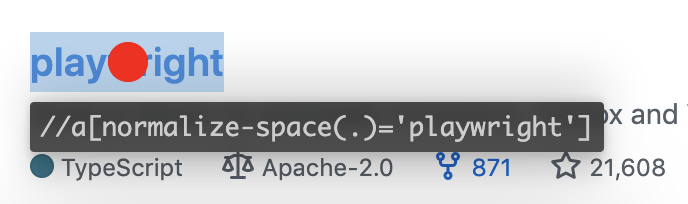
Now we know what action is about to be performed and we can look into the details on that action. For example, when stopped on an input action such as click, the exact point Playwright is about to click is highlighted with the large red dot on the inspected page:
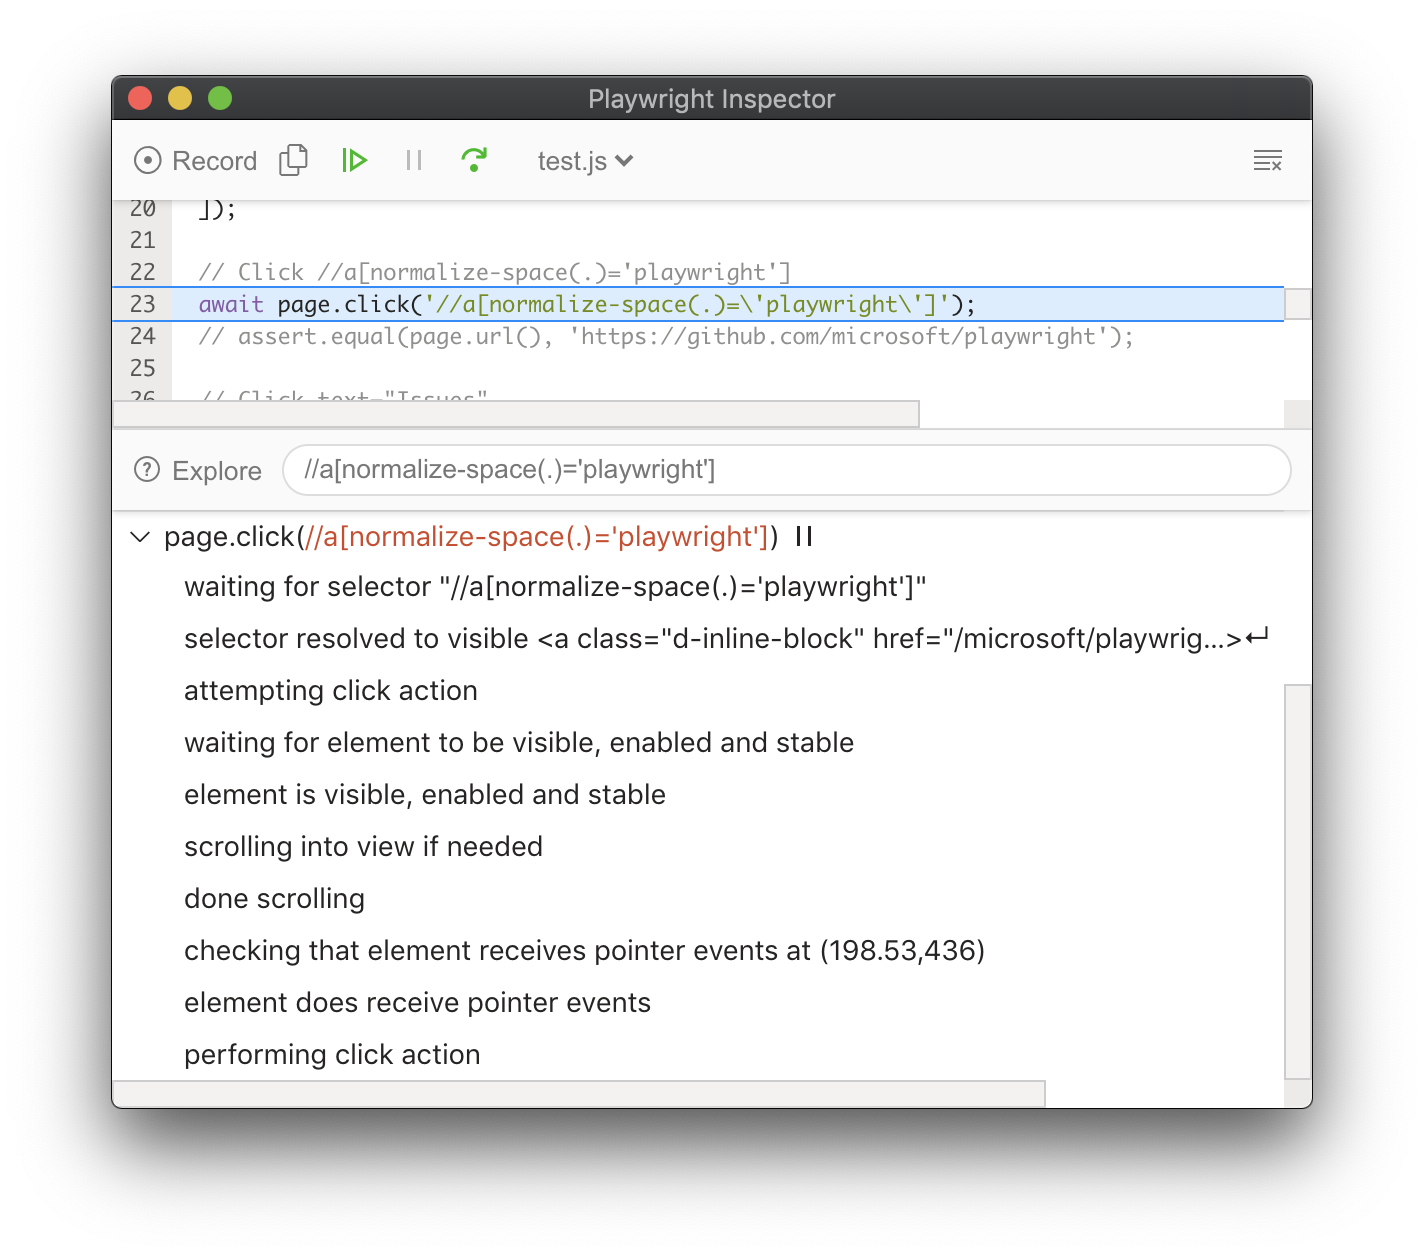
By the time Playwright has paused on that click action, it has already performed actionability checks that can be found in the log:
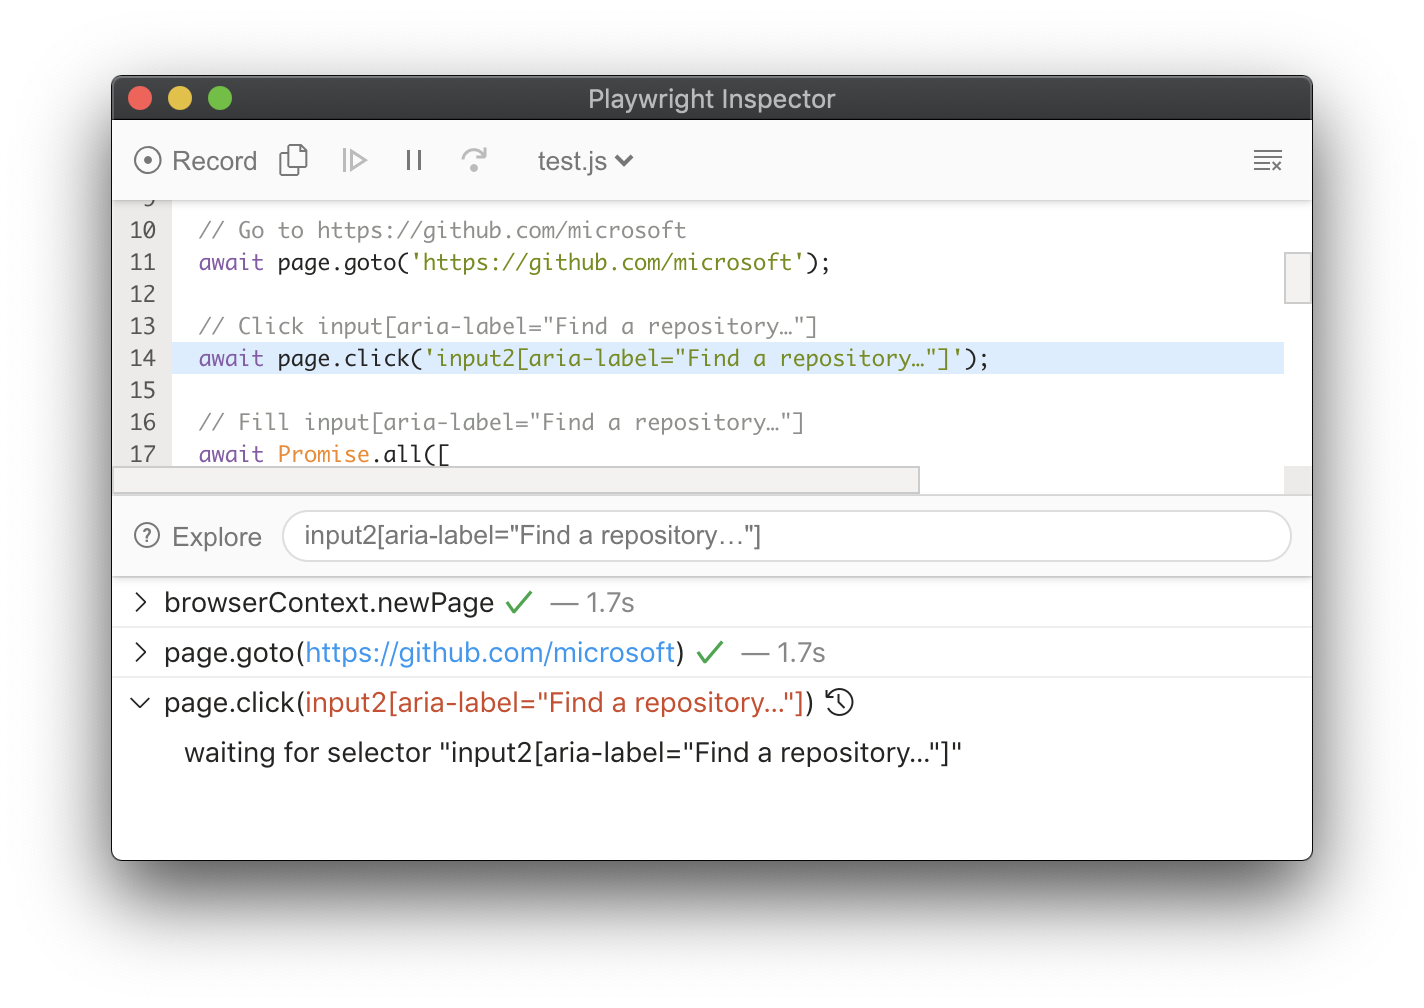
If actionability can't be reached, it'll show action as pending:
You can step over each action using the "Step over" action or resume script without further pauses:

Using Browser Developer Tools#
You can use browser developer tools in Chromium, Firefox and WebKit while running a Playwright script, with or without Playwright inspector. Developer tools help to:
- Inspect the DOM tree
- See console logs during execution (or learn how to read logs via API)
- Check network activity and other developer tools features
note
For WebKit: launching WebKit Inspector during the execution will prevent the Playwright script from executing any further.
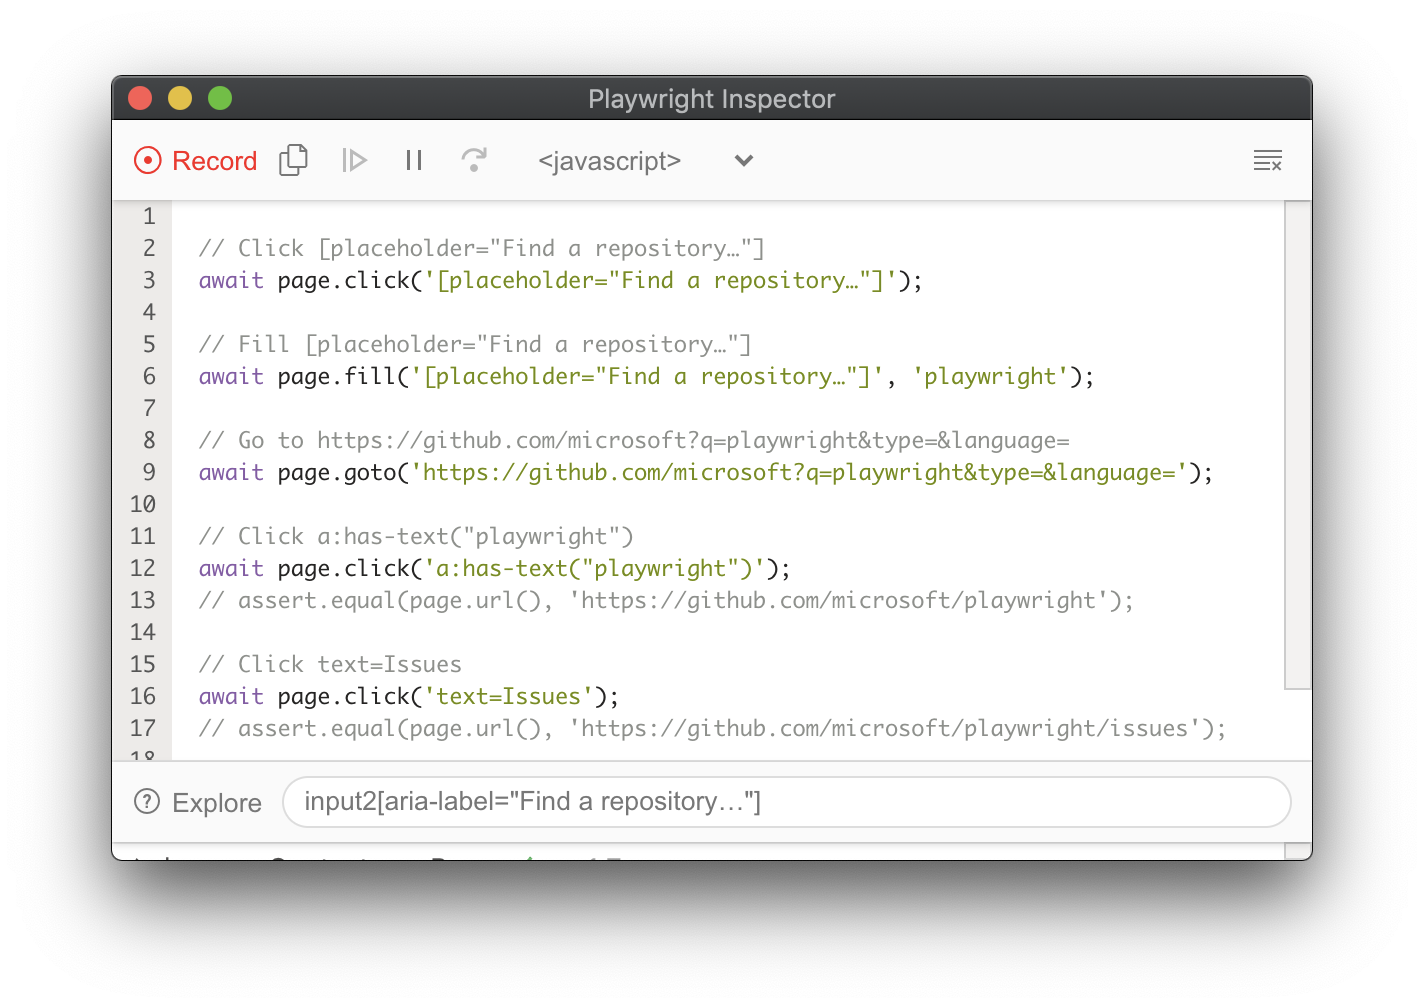
Debugging Selectors#
- Click the Explore button to hover over elements in the screen and click them to automatically generate selectors for those elements.
- To verify where selector points, paste it into the inspector input field:

Recording scripts#
At any moment, clicking Record action enables recorder (codegen) mode. Every action on the target page is turned into the generated script:
You can copy entire generated script or clear it using toolbar actions.